Mouse brain seen in sharpest detail ever
October 26, 2010

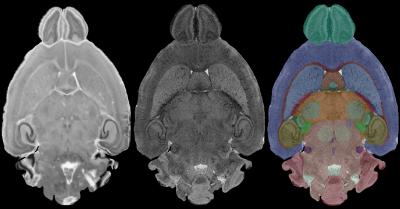
The image on the left is a conventional (optical) histology image. The middle panel is taken from the MR images that define a WHS*. Using these several types of MR images, experienced neuroanatomists defined the boundaries of a number of regions of the brain -- hippocampus, striatum, cerebellum etc. These boundaries are actually defined in all three planes so a surface of the structure is defined. This "slice" from the whole intact brain is completely without distortion caused by removing from the skull. The left image uses color labels for the structures. (G. Allan Johnson, Duke Center for In Vivo Microscopy)
The most detailed magnetic resonance images ever obtained of a mammalian brain are now available to researchers in a free online atlas of an ultra-high-resolution mouse brain, thanks to work at the Duke Center for In Vivo Microscopy.
In a typical clinical MRI scan, each pixel in the image represents a cube of tissue, called a voxel, which is typically 1x1x3 millimeters. “The atlas images, however, are more than 300,000 times higher resolution than an MRI scan, with voxels that are 20 micrometers on a side,” said G. Allan Johnson, Ph.D., who heads the Duke Center for In Vivo Microscopy and is Charles E. Putman Distinguished Professor of Radiology.
The interactive images in the atlas will allow researchers worldwide to evaluate the brain from all angles and assess and share their mouse studies against this reference brain in genetics, toxicology and drug discovery.
The brain atlas’ detail reaches a resolution of 21 microns (micrometers). A micron is a millionth of a meter, or 0.00003937 of an inch.
An article detailing the creation of the atlas was published as the cover story in the November issue of NeuroImage journal.
The atlas used three different magnetic resonance microscopy protocols of the intact brain followed by conventional histology to highlight different structures in the reference brain. The brains were scanned using an MR system operating at a magnetic field more than 6 times higher than is routinely used in the clinic. The images were acquired on fixed tissues, with the brain in the cranium to avoid the distortion that occurs when tissues are thinly sliced for conventional histology.

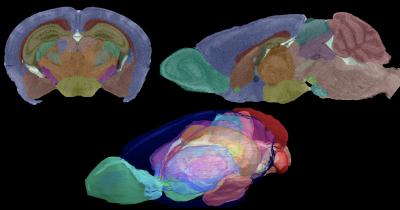
All the MR data are isotropic (viewable the same from any direction). Thus, there is no loss of resolution between the topleft coronal plane and the sagittal plane shown by the image on the top right. The color labels superimposed in Waxholm Space show the 3-D juxtaposition of structure in the volume-rendered bottom image. Codes to the colors are provided by the system. (G. Allan Johnson, Duke Center for In Vivo Microscopy)
The new Waxholm Space brain can be digitally sliced from any plane or angle, so that researchers can precisely visualize any regions in the brain, along any axis without loss of spatial resolution. (Waxholm is the Swedish town where the early concepts gelled for this atlas.)
“Researchers can take the reference brain apart and put it back together, because we have the 3-D data set intact, and any section will have the same excellent resolution,” said Johnson, who is also a professor of biomedical engineering and physics at Duke. “It eliminates the Humpty Dumpty problem that researchers used to face when they made 3-D measurements of brain structures.”
For example, a geneticist might want to alter a mouse’s genotype in an experiment and learn what happens when the animal becomes highly responsive to fear challenges. “It would be interesting to see if the amygdala (a brain center related to emotional arousal) is really smaller or larger in the animal,” Johnson said. “However, if you do conventional histology, the animal brain shrinks when it is dried or prepared in alcohol, sometimes by about 40 percent. Because of variability, that would make it challenging to measure. This atlas provides a reference to measure against.”
The team was also able to digitally segment 37 unique brain structures using the three different data acquisition strategies.
Scientists obtained images of brains from eight mice of the most frequently used strain of laboratory mice (C57BL), aged 66-78 days old. They registered the images together and created both an average and a probabilistic brain for reference. The average and probabilistic brains provide quantitative measure of variability. “It was truly remarkable how alike these structures were from brain to brain,” he said.
All of the data is available on the web. As new data is gathered from other sources, researchers will be able to register it to the same coordinate system, which will promote data sharing, Johnson said. For example the Duke group has recently added data — also at the highest resolution yet attained — that allows definition of fiber tracts connecting different parts of the brain. Investigators at the Allen Brain Institute are now using the MR data to provide 3-D location for their extensive gene expression studies.
* Waxholm Space (WHS) is a conceptual and real space space into which each researcher would map their results, Dr. G. Allan Johnson, Charles E. Putman Professor of Radiology, Physics, and Biomedical Engineering explained to KurzweilAI.
“The concept of WHS originated at a meeting of the DIgital Atlasing Task Force of the International Neuroinformatics Coordinating Facility ( incf.or). The meeting was held in Waxholm Sweden in 2008. The Task Force suggested the concept of a three dimensional coordinate system to define the anatomy of the mouse brain.
“This coordinate system would allow a researcher in Germany working on a mouse model of Alzheimer’s disease to compare his/her findings about an upregulated gene in a specific part of the mouse brain to the work of an investigator in Australia who had found difference in vascular conformation in a mouse model of aging. Since the mouse brains for each of these researchers might be different, one is faced with a problem of relating the two results.
“Each researcher could ‘map” their results into this common space. Mapping employs a series of mathematical transformations that make the structures (hippocampus, amygdahla, cortex, cereblellum) of both animals “line up” — overlap. The concept is implemented through the real coordinate system defined in this article. This coordinate system is based on a very high resolution 3D MR image of the C57 adult mouse.”
Adapted from materials provided by Duke University Medical Center
