First map of how the brain organizes everything we see
December 20, 2012

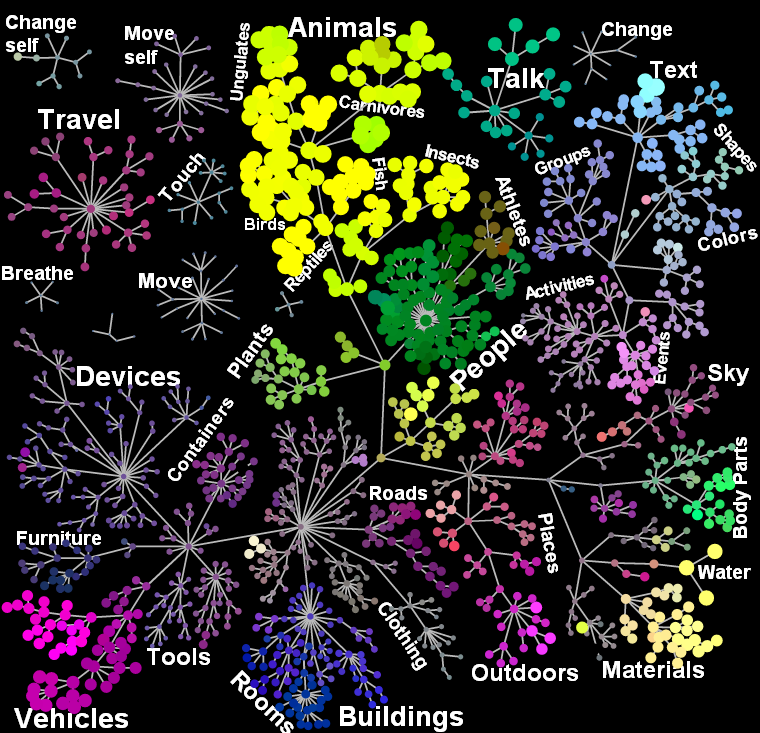
These sections of a semantic-space map show how some of the different categories of living and non-living objects that we see are related to one another in the brain’s “semantic space” (credit: Shinji Nishimoto, An T. Vu, Jack Gallant/Neuron)
How do we make sense of the thousands of images that flood our retinas each day? Scientists at the University of California, Berkeley, have found that the brain is wired to organize all the categories of objects and actions that we see, and they have created the first interactive map of how the brain organizes these groupings.
Continuous semantic space
The result — achieved through computational models of brain imaging data collected while the subjects watched hours of movie clips — is what researchers call “a continuous semantic space.”
Some relationships between categories make sense (humans and animals share the same “semantic neighborhood”) while others (hallways and buckets) are less obvious. The researchers found that different people share a similar semantic layout.
“Our methods open a door that will quickly lead to a more complete and detailed understanding of how the brain is organized. Already, our online brain viewer appears to provide the most detailed look ever at the visual function and organization of a single human brain,” said Alexander Huth, a doctoral student in neuroscience at UC Berkeley and lead author of the study published Wednesday, Dec. 19 in the journal Neuron.
Medical diagnosis/treatment, brain-machine interfaces

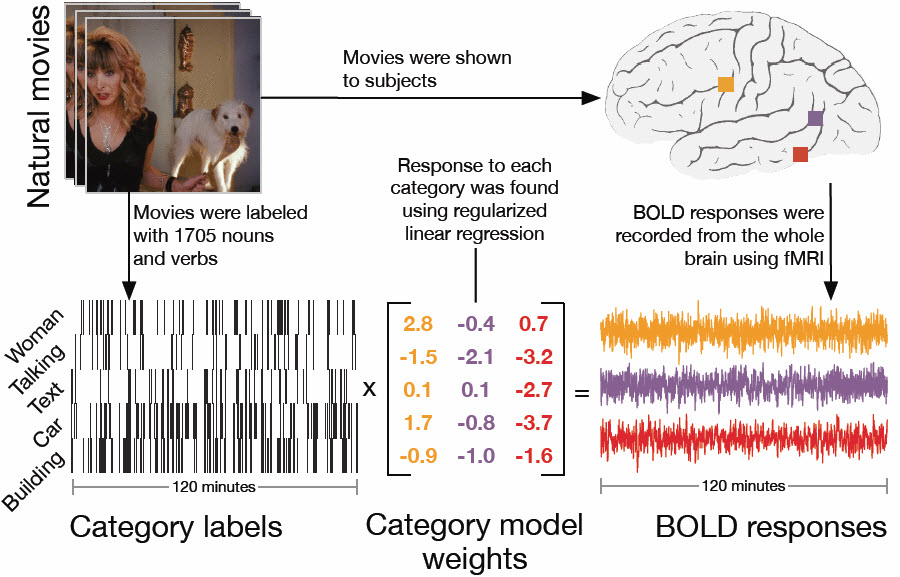
Semantic-space map construction process (Credit: Shinji Nishimoto, An T. Vu, Jack Gallant/Neuron)
A clearer understanding of how the brain organizes visual input can help with the medical diagnosis and treatment of brain disorders. These findings may also be used to create brain-machine interfaces, particularly for facial and other image recognition systems. Among other things, they could improve a grocery store self-checkout system’s ability to recognize different kinds of merchandise.
”Our discovery suggests that brain scans could soon be used to label an image that someone is seeing, and may also help teach computers how to better recognize images,” said Huth, who has produced a video and interactive website to explain the science of what the researchers found.
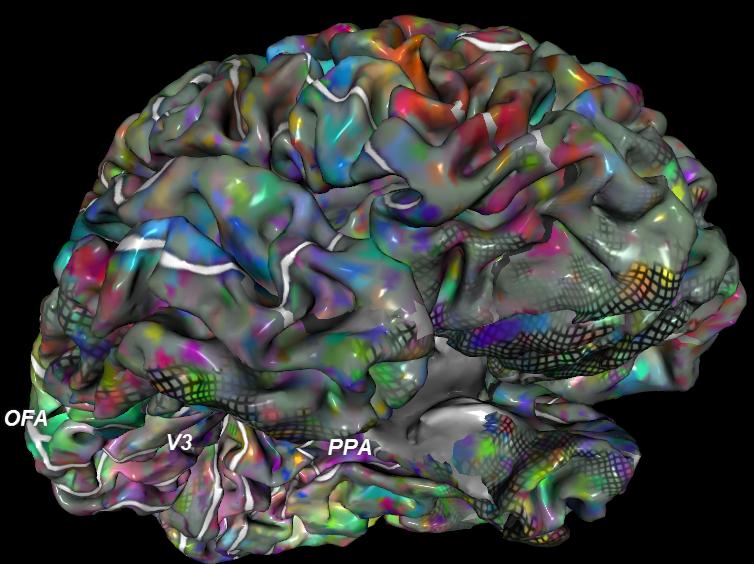
It has long been thought that each category of object or action humans see — people, animals, vehicles, household appliances and movements — is represented in a separate region of the visual cortex. In this latest study, UC Berkeley researchers found that these categories are actually represented in highly organized, overlapping maps that cover as much as 20 percent of the brain, including the somatosensory and frontal cortices.
To conduct the experiment, the brain activity of five researchers was recorded via functional magnetic resonance imaging (fMRI) as they each watched two hours of movie clips. The brain scans simultaneously measured blood flow in thousands of locations across the brain.
Researchers then used regularized linear regression analysis, which finds correlations in data, to build a model showing how each of the roughly 30,000 locations in the cortex responded to each of the 1,700 categories of objects and actions seen in the movie clips. Next, they used principal components analysis, a statistical method that can summarize large data sets, to find the “semantic space” that was common to all the study subjects.
The results are presented in multicolored, multidimensional maps showing the more than 1,700 visual categories and their relationships to one another. Categories that activate the same brain areas have similar colors. For example, humans are green, animals are yellow, vehicles are pink and violet and buildings are blue.
“Using the semantic space as a visualization tool, we immediately saw that categories are represented in these incredibly intricate maps that cover much more of the brain than we expected,” Huth said.
Other co-authors of the study are UC Berkeley neuroscientists Shinji Nishimoto, An T. Vu and Jack Gallant.

An MRI viewer on the Gallant Lab website (gallantlab.org/semanticmovies) shows how information about the thousands of object and action categories is represented across human neocortex (credit: Shinji Nishimoto, An T. Vu, Jack Gallant/Neuron)
